Atlas offers new perspective on Covid-19
How did the coronavirus spread in Switzerland? How did it spread worldwide? And how does that relate to the number of hospitals and inhabitants? The “Atlas of Switzerland - online" has published two new 3D maps that offer readers a spatial view on the spread of the Covid-19 pandemic and also allow for comparisons with other maps.
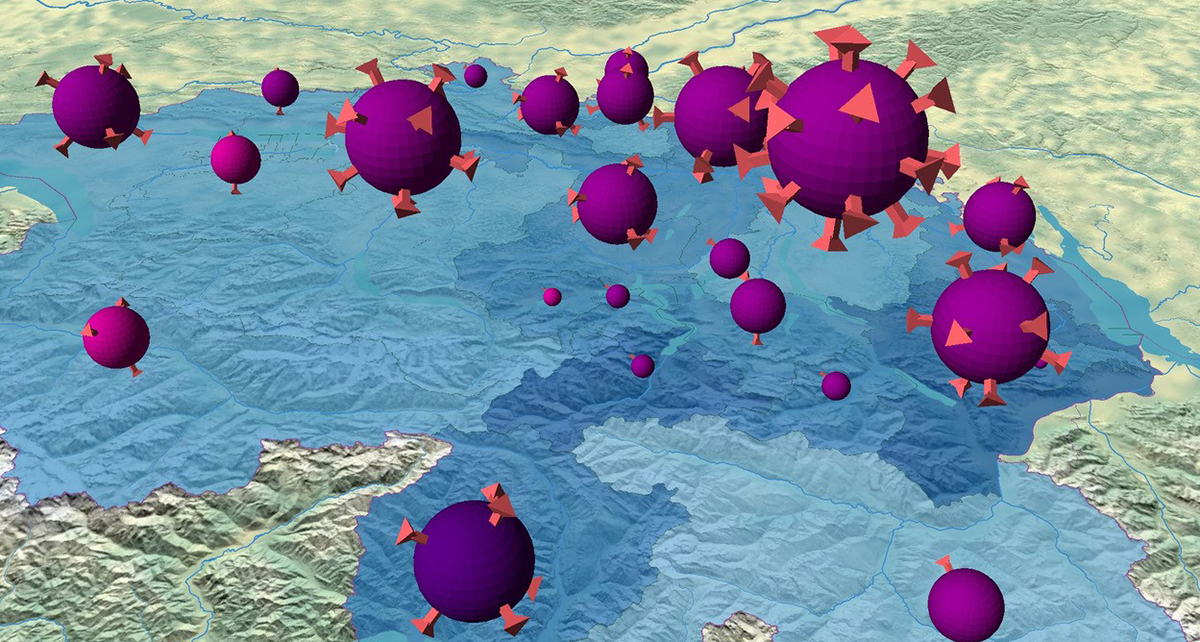
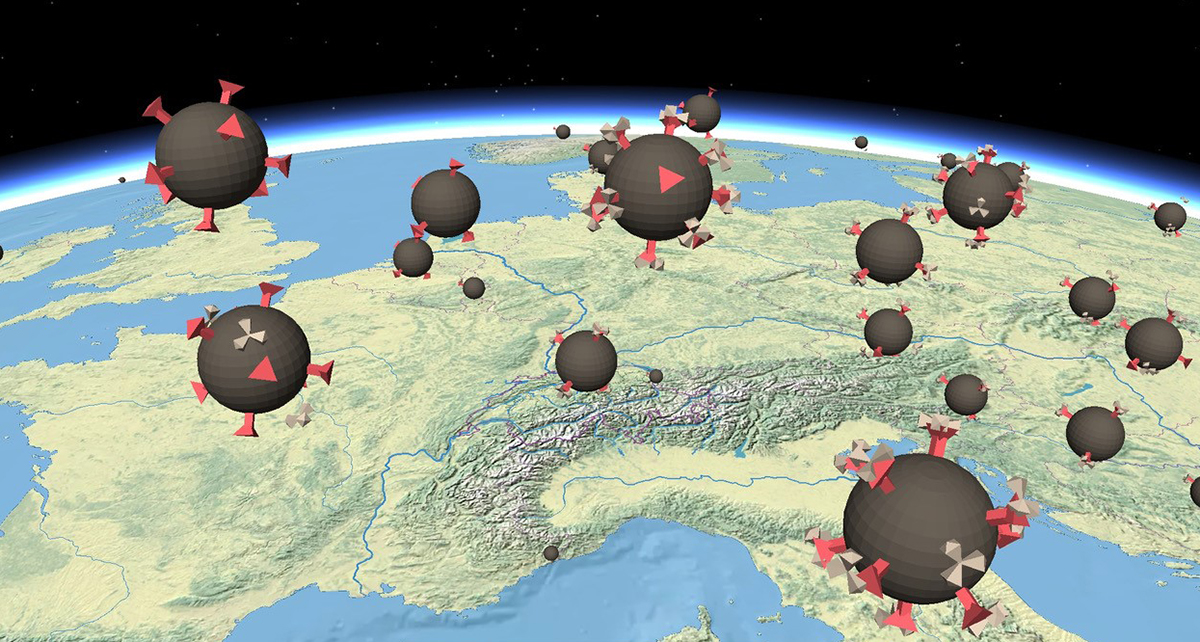
Since the "Atlas of Switzerland" went online in 2016, the multi-award-winning collection has grown steadily. Around 300 map topics have been added in the past five years. Among the most recent examples are also two visualizations related to the Covid-19 pandemic. For this purpose, the atlas research team used data on the epidemiological situation in Switzerland and worldwide. The developed 3D maps use an abstracted model of the virus, offering an entirely new perspective on the spatial distribution of the pandemic since its beginnings.
Users have various possibilities to interact with the maps. The visualizations of the virus model are scaled according to the number of cases and can be clicked to provide more information about the ratio of laboratory-confirmed cases, incidences, deaths, and positivity rates in each region. For more detailed comparisons, for example between cantons, a comparison panel with bar charts can be used. Another tool – a timeline – can be used to track the development of the pandemic on a monthly cumulative basis since February 2020.
Furthermore, readers are invited to compare different map topics. Up to three maps can be superimposed and compared, such as data on the incidence of infection with data on hospital locations and the like.
The data originate from the Swiss Federal Office of Public Health and the international Covid-19 Data Hub. The visualizations are inspired by a scientific 3D model of the SARS-CoV-2 virus by Visual Science.
The Download Atlas of Switzerland - online is available in four languages and can be used free of charge. The comprehensive collection currently offers more than 350 specialised maps in categories such as “nature”, “society”, “economy”, “energy” and is constantly being expanded. Besides the Covid-19 visualizations, there are also easy-to-access topics among the most recent additions, such as maps on the "number of registered dogs" or the "infrastructure of campsites". The online atlas can be downloaded free of charge Download here.
Contact the Atlas research team at the Professorial Chair for Cartography.
Read ETH News article New 3D atlas for map lovers (June 2016)