The view from space – and what it tells us
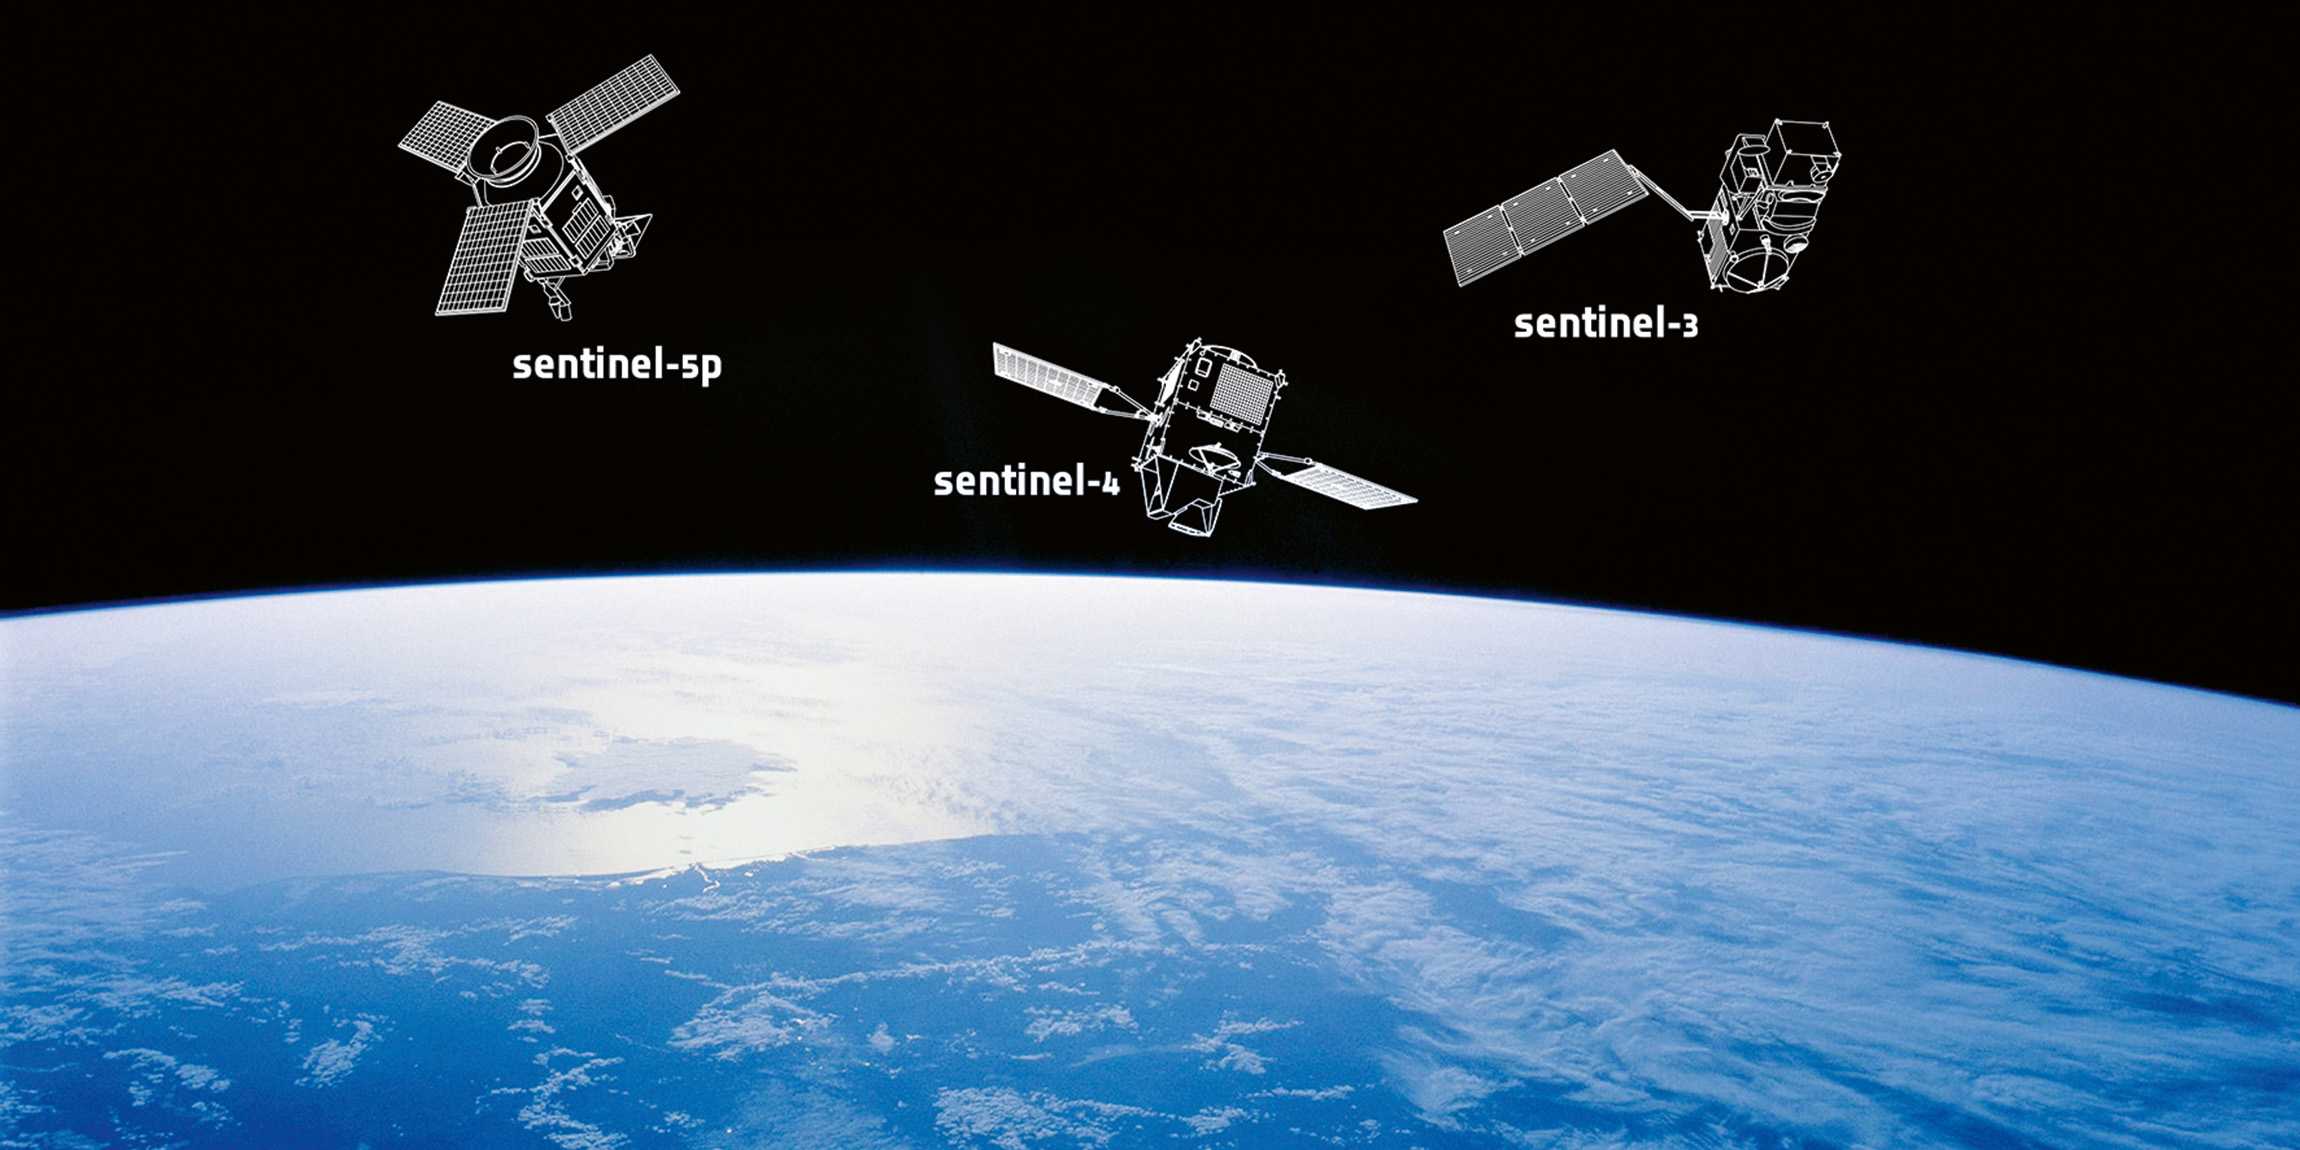
Earth-observation satellites deliver data for a wealth of applications – from monitoring climate change and documenting war crimes to planning disaster relief and assessing snow depth. ETH researchers from the Department of Civil, Environmental and Geomatic Engineering are also big beneficiaries.

Orbiting at an altitude of 700 kilometres, satellites of the European Space Agency (ESA) transmit radar signals down to Earth. These are scattered by the planet’s surface and reflected back to the satellite, yielding images of the terrain even when the sky is overcast. Right now, Konrad Schindler and his team are interested in images of Ukraine. “Satellites fly over the country every couple of days, which gives us a kind of slow-motion video,” says Schindler, head of the Institute of Geodesy and Photogrammetry at ETH Zurich. “If the signal hits a heap of rubble where there were once intact buildings, then it bounces back in a different form.” This is because smooth surfaces reflect radio waves more effectively than rough surfaces.
Not that the naked eye could make much sense of this stream of freely accessible images. That’s the job of an automatic monitoring system that harnesses the power of artificial intelligence. “The system uses statistics to identify patterns in the data,” Schindler explains. This is an example of machine learning, whereby an Al system is trained with reference images that clearly show, for example, the difference between a building that has been destroyed and one that is still intact.
These reference data were provided by UNOSAT, the United Nations Satellite Centre. Here, experts painstakingly inspect high-resolution images from commercial sources in order to identify damage to buildings and thereby document war crimes such as the bombing of civilian infrastructure. “Our monitoring system is certainly not designed to replace these people,” says Schindler. “But its ability to cover large areas gives them useful guidance on where to take a closer look.”
Maps for aid organisations
The mapping of war damage is one of two projects on which ETH researchers have collaborated with the International Committee of the Red Cross (ICRC). “The second one sought to answer what might seem like a very simple question – namely, where are the people?” Schindler explains. When the ICRC launches relief operations or vaccination campaigns in the wake of natural disasters, it needs data on population density. In less developed countries, this is often lacking – and that’s when the Red Cross falls back on the population maps that Schindler’s group creates from satellite data.
ETH researchers use this powerful cocktail of satellite observation and machine learning across a wide range of areas. In collaboration with the Swiss start-up ExoLabs, for example, they have developed a system that delivers a faster and more accurate assessment of snow cover than that from conventional sources. The researchers began by feeding the system with estimates of snow depth in Switzerland based on satellite images and digital elevation maps. Using comparisons with precise data gathered by aircraft and meteorological ground stations, the system learned how to improve the satellite-based estimates. Now it provides daily snow depth maps, a service that will soon be launched on a commercial basis.
A global map of tree heights has already been made freely available. Also based on satellite data, this is primarily used for environmental purposes. “Obviously, you can’t see the bottom of a tree from space, but the reflected signal contains detailed content, particularly in the infrared range, from which a lot of information about vegetation can be obtained,” Schindler explains. Using reference data from a laser scanner on board the International Space Station (ISS), a computer program has learned how to derive tree heights on the basis of illumination patterns of the area under observation. A laser pulse bouncing back from a treetop takes minimally less time to return to the ISS than one reflected from the ground below. This difference is enough to calculate the height of local vegetation.
Early-warning system for forests
“The global mapping of canopy heights also provides interesting information on the age of the vegetation,” says Verena Griess, Professor of Forest Resources Management and head of the Institute of Terrestrial Ecosystems at ETH Zurich. She and her team are using satellite data to discover more about tree health. “Climate change has propelled us into an era of rapid change,” says Griess. “This also applies to our forests, where problems caused by pests, blowdown, fire and drought are very much on the rise.” Using satellite data, the researchers plan to set up an early-warning system that will alert us to distressed woodland even before such damage is visible to the human eye. This system could also be used to detect the first signs of forest fires in sparsely populated areas, or to show where remedial measures are required in Switzerland to safeguard the protection against natural hazards that forestry affords. Satellite data could also identify areas that are suitable for timber extraction or that require conservation due to their high biodiversity. “Our aim is to ensure that the right decision is made for each place,” Griess explains.
Researchers are now working on a model that will be able to automatically identify tree species from satellite images. Trained on data from locations where species such as beech, spruce or larch are known to be growing, the model gradually learns to identify the corresponding patterns in satellite images. Using hyperspectral sensors, satellites can also collect information on tree health that is invisible to the human eye. This includes measuring the concentration of certain substances in the leaves and monitoring any changes that might indicate the early stages of a pest infestation.
About
Verena Griess is Professor of Forest Resources Management in the Department of Environmental Systems Science at ETH Zurich
Konrad Schindler is Professor of Photogrammetry and Remote Sensing in the Department of Civil, Environmental and Geomatic Engineering at ETH Zurich.
Benedikt Soja is Professor of Space Geodesy in the Department of Civil, Environmental and Geomatic Engineering at ETH Zurich. This professorship was funded by the Dr. Alfred and Flora Spälti Fonds.
Two-dimensional satellite images can also be enriched with 3D data from laser scanners either on board satellites, aircraft or drones, or located on the ground. ETH recently inaugurated its Alps supercomputer, which will speed up data analysis and improve the training of AI models. “This technology adds yet another string to our bow, alongside our outstanding students and the excellent collaboration between university professorships and other member institutions of the ETH Domain,” says Griess. “Switzerland now has a real wealth of expertise in this area, concentrated to a degree you won’t find anywhere else.”
Gps technology repurposed
The health of woodland trees can also be investigated using signals from GPS satellites. When a GPS receiver is placed under a tree and another one at a distance, the difference in the signals received can serve to calculate how much biomass the tree contains. “It’s amazing what you can do with a technology that was developed for something entirely different – in this case, navigation,” says Benedikt Soja, Professor of Space Geodesy.
In collaboration with MeteoSwiss, Soja and his team have installed low-cost GPS receivers at several weather stations located throughout Switzerland. They measure the level of water vapour in the atmosphere by detecting the corresponding delay in the propagation of radio signals transmitted by satellites. This data is then used to calculate the humidity above a weather station and thereby improve rain forecasts.
At the same time, the analysis of such data over a longer period of time also yields information on climate change. A warmer atmosphere absorbs more moisture – i.e., more water vapour. “This in turn intensifies climate change, because water vapour is also a greenhouse gas – in fact, the most abundant of all,” Soja explains. “This makes it very easy to determine the local impact of climate change on the atmosphere.” GPS measurements show that, on average, some regions have become wetter and others drier.
Researchers are harnessing another technique to track the melting of ice sheets in Greenland and Antarctica. Two satellites flying in tandem measure the Earth’s gravity field, which varies according to how much mass is present at a particular location. “This means we can measure any changes in this mass from space,” explains Soja. This data can be further refined with the help of other satellites that measure altitude. “The polar regions are seeing massive ice melt. We’re losing hundreds of gigatons of ice each year – the equivalent of a gigantic 3,000-metre-high cube the size of the city of Zurich – and this is causing sea levels to rise,” says Soja. “Satellite observation is the best way of tracking the impact that climate change is having on the Antarctic and Greenland ice sheets.”
